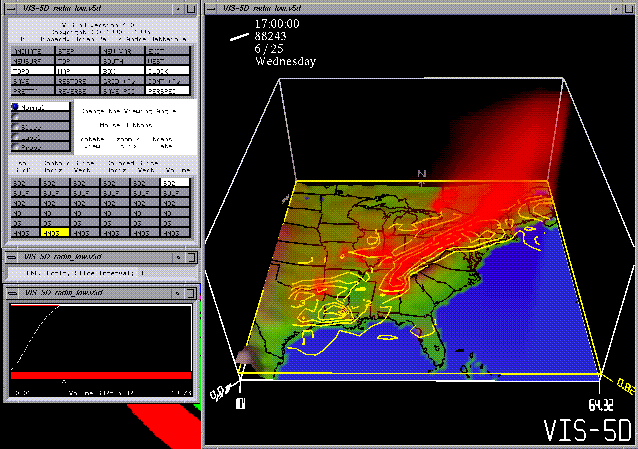

This image is a snapshot of Vis5D being applied to the output of the EPA's Regional Acid Deposition Model (RADM), showing a transparent volume rendering of SO2 (the red fog) and a horizontal slice with iso-lines of HNO3 over a topographical map of the Eastern U.S. The icons on the left give scientists interactive control over the three-dimensional images as they are animated. Vis5D makes this interactive exploration possible by compressing data sets so they fit in workstation memories.
Click here to see an image of acid rain formation. The yellow surface shows concentrations of a nitrous oxide and the white fog shows nitric acid formed when nitous oxides react with moisture.
This report was updated on 10 May 1996. The technical and WWW contact is:
Bill Hibbard, SSEC, 1225 W. Dayton St., Madison, WI 53706 email: whibbard@macc.wisc.edu voice: 608-263-4427 fax: 608-263-6738
The Vis5D system is very widely used by scientists to visualize the output of their numerical simulations of the Earth's atmosphere and oceans. It is also used a testbed for developing new visualization techniques. We use Vis5D for experiments with the BLANCA Network as part of the Gigabit Testbed Project, and we have adapted Vis5D to run in the virtual reality CAVE. We used Vis5D to generate The SIGGRAPH 94 Daily Weather Forecast demo in the VROOM (virtual reality room) at Siggraph '94.
The VisAD system enables scientists to interactively steer and visualize their computations. The VisAD system is based on very general conceptual models of data, computation and display, in order to adapt easily to a wide variety of scientific applications.
Here are a few publications by the SSEC Visualization Project: